Ecosight
Project
Project
Project
Project
Project
Project
AI climate analytics platform for tracking, forecasting, and understanding emissions at a glance.
Year
2026
Industry
Climate Tech / AI
Role
Web Design, UI System
Timeline
3 weeks
OVERVIEW
Climate products carry a hard problem. The data is heavy — emissions, energy, waste, ESG, audits — and most of it ends up in dashboards no one wants to open. Ecosight needed the opposite. A surface where dense climate data reads as one clear system, not a wall of numbers.
Climate products carry a hard problem. The data is heavy — emissions, energy, waste, ESG, audits — and most of it ends up in dashboards no one wants to open. Ecosight needed the opposite. A surface where dense climate data reads as one clear system, not a wall of numbers.
Our goal was to build one reading surface. Not more charts, but less friction. Every screen had to answer the same question fast — where are we now, and what comes next. Design here is not the decoration on top of the data. It is the thing that makes the data make sense.
Our goal was to build one reading surface. Not more charts, but less friction. Every screen had to answer the same question fast — where are we now, and what comes next. Design here is not the decoration on top of the data. It is the thing that makes the data make sense.


THE CHALLENGE
Make heavy data feel light
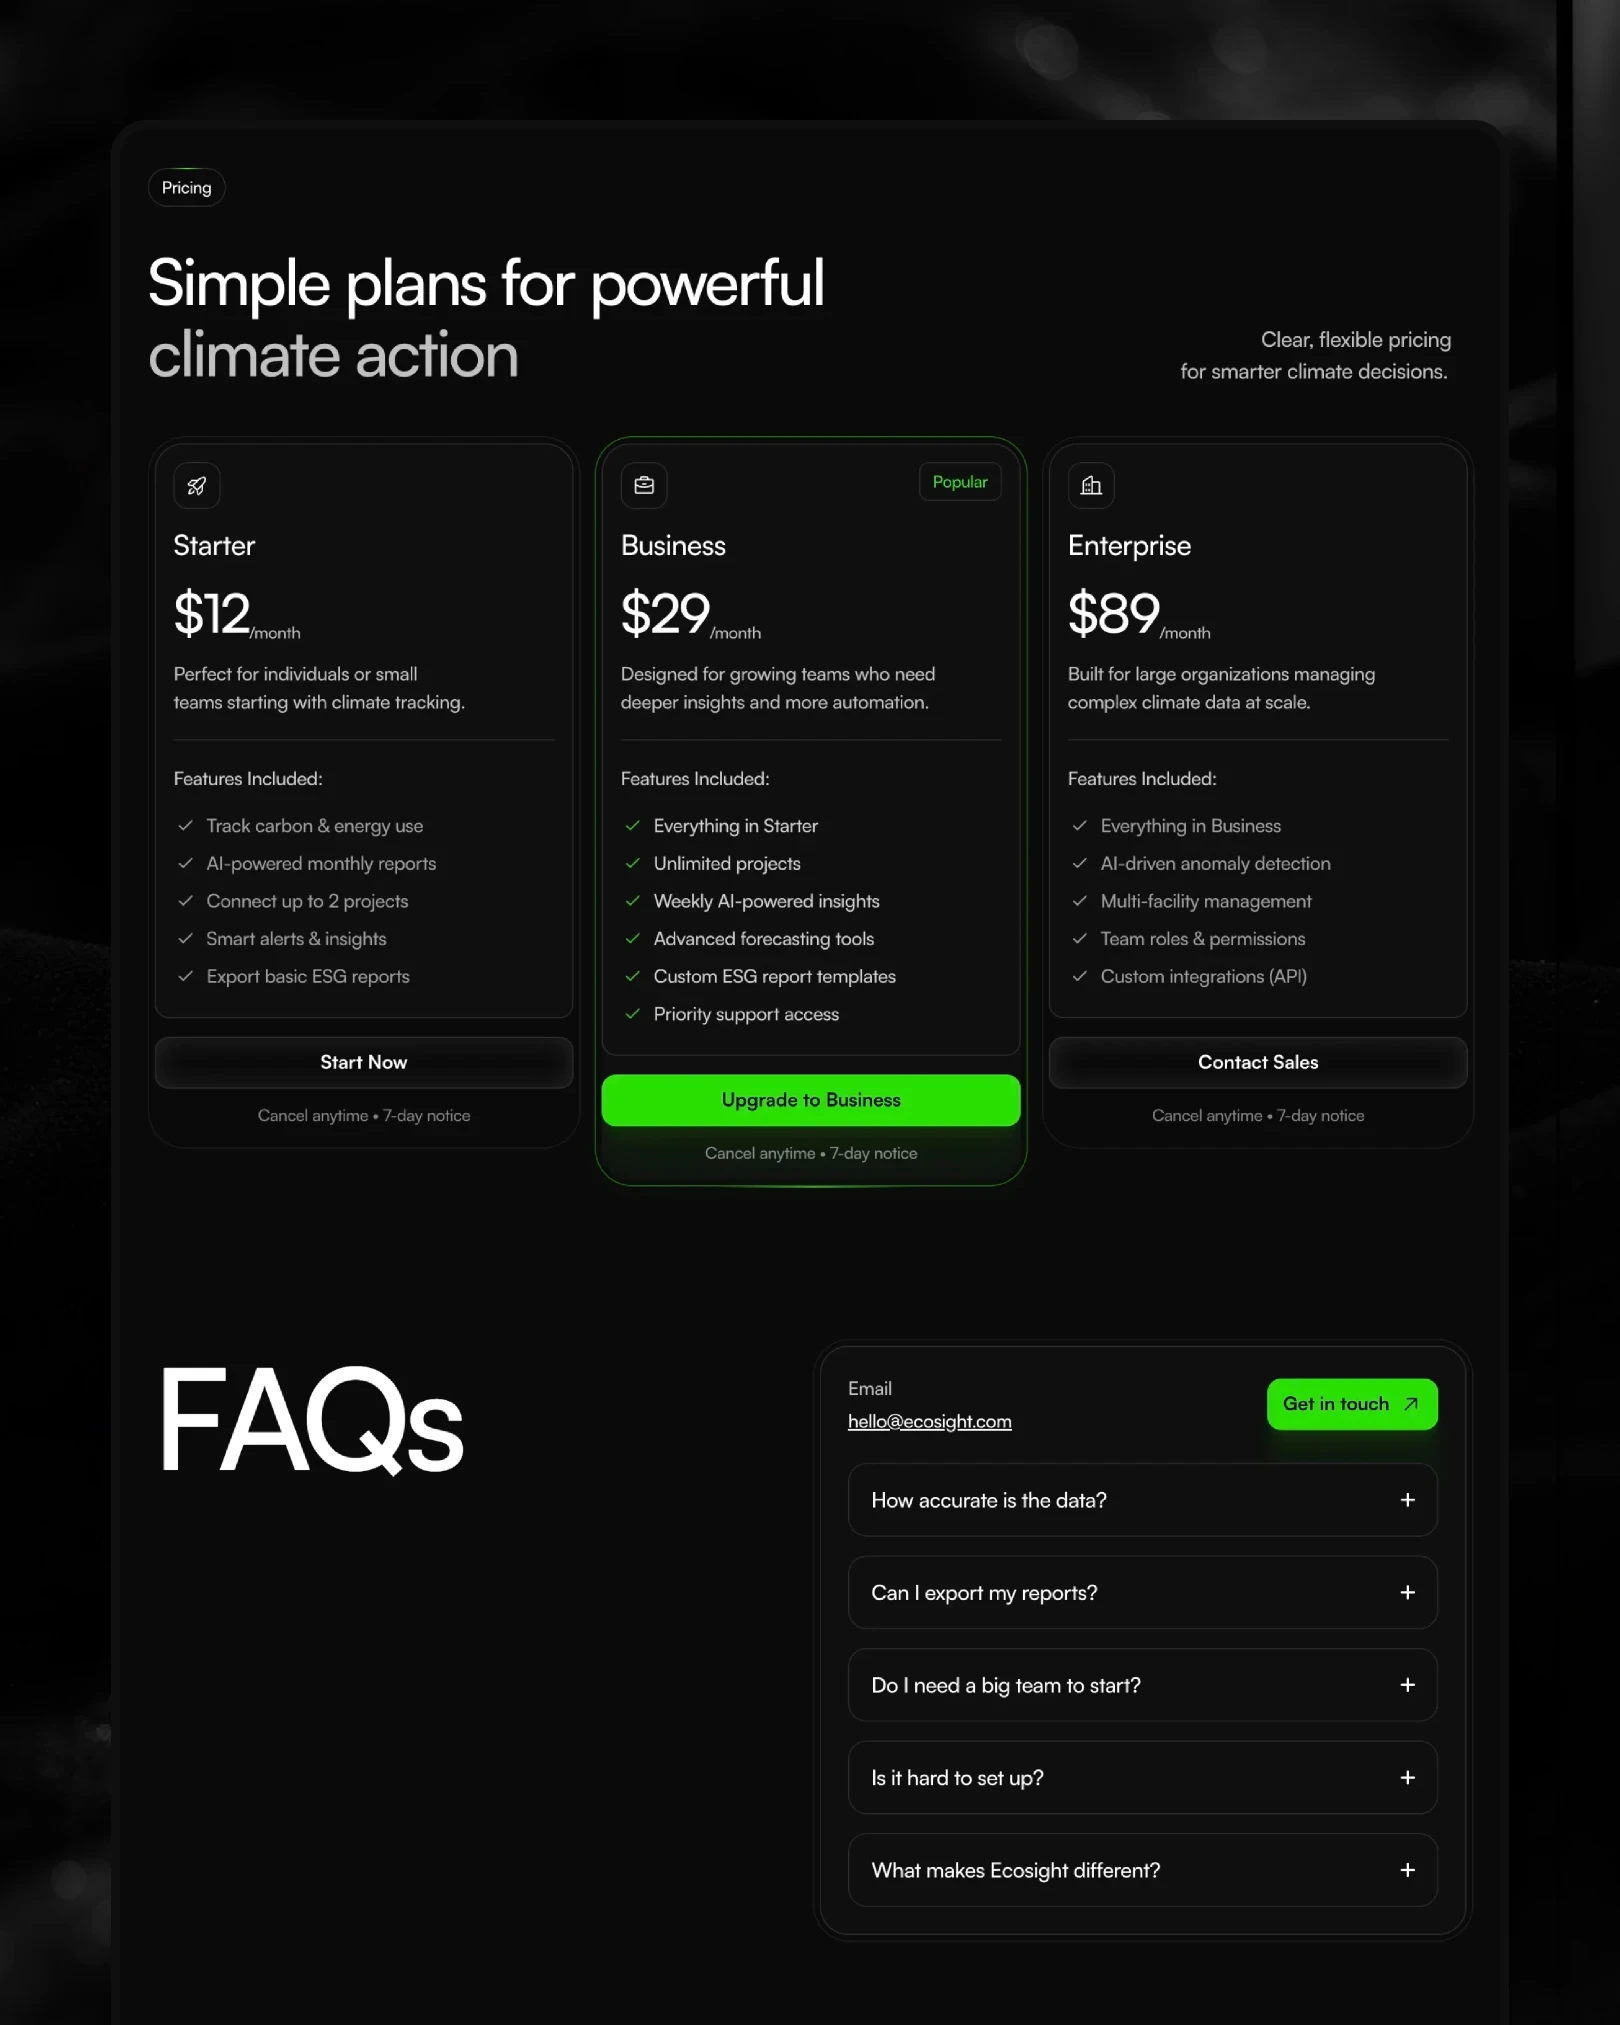
Climate tools fail in the same place. They show everything, so they explain nothing. The challenge here was not visual. It was perception. How do you take CO₂, energy, forecasts, compliance reports, and goals, and make a founder understand the state of things in one glance. The answer was structure before surface. One logic running across every screen, so the eye always knows where to land.
Climate tools fail in the same place. They show everything, so they explain nothing. The challenge here was not visual. It was perception. How do you take CO₂, energy, forecasts, compliance reports, and goals, and make a founder understand the state of things in one glance. The answer was structure before surface. One logic running across every screen, so the eye always knows where to land.
DIRECTION
Three decisions
Color
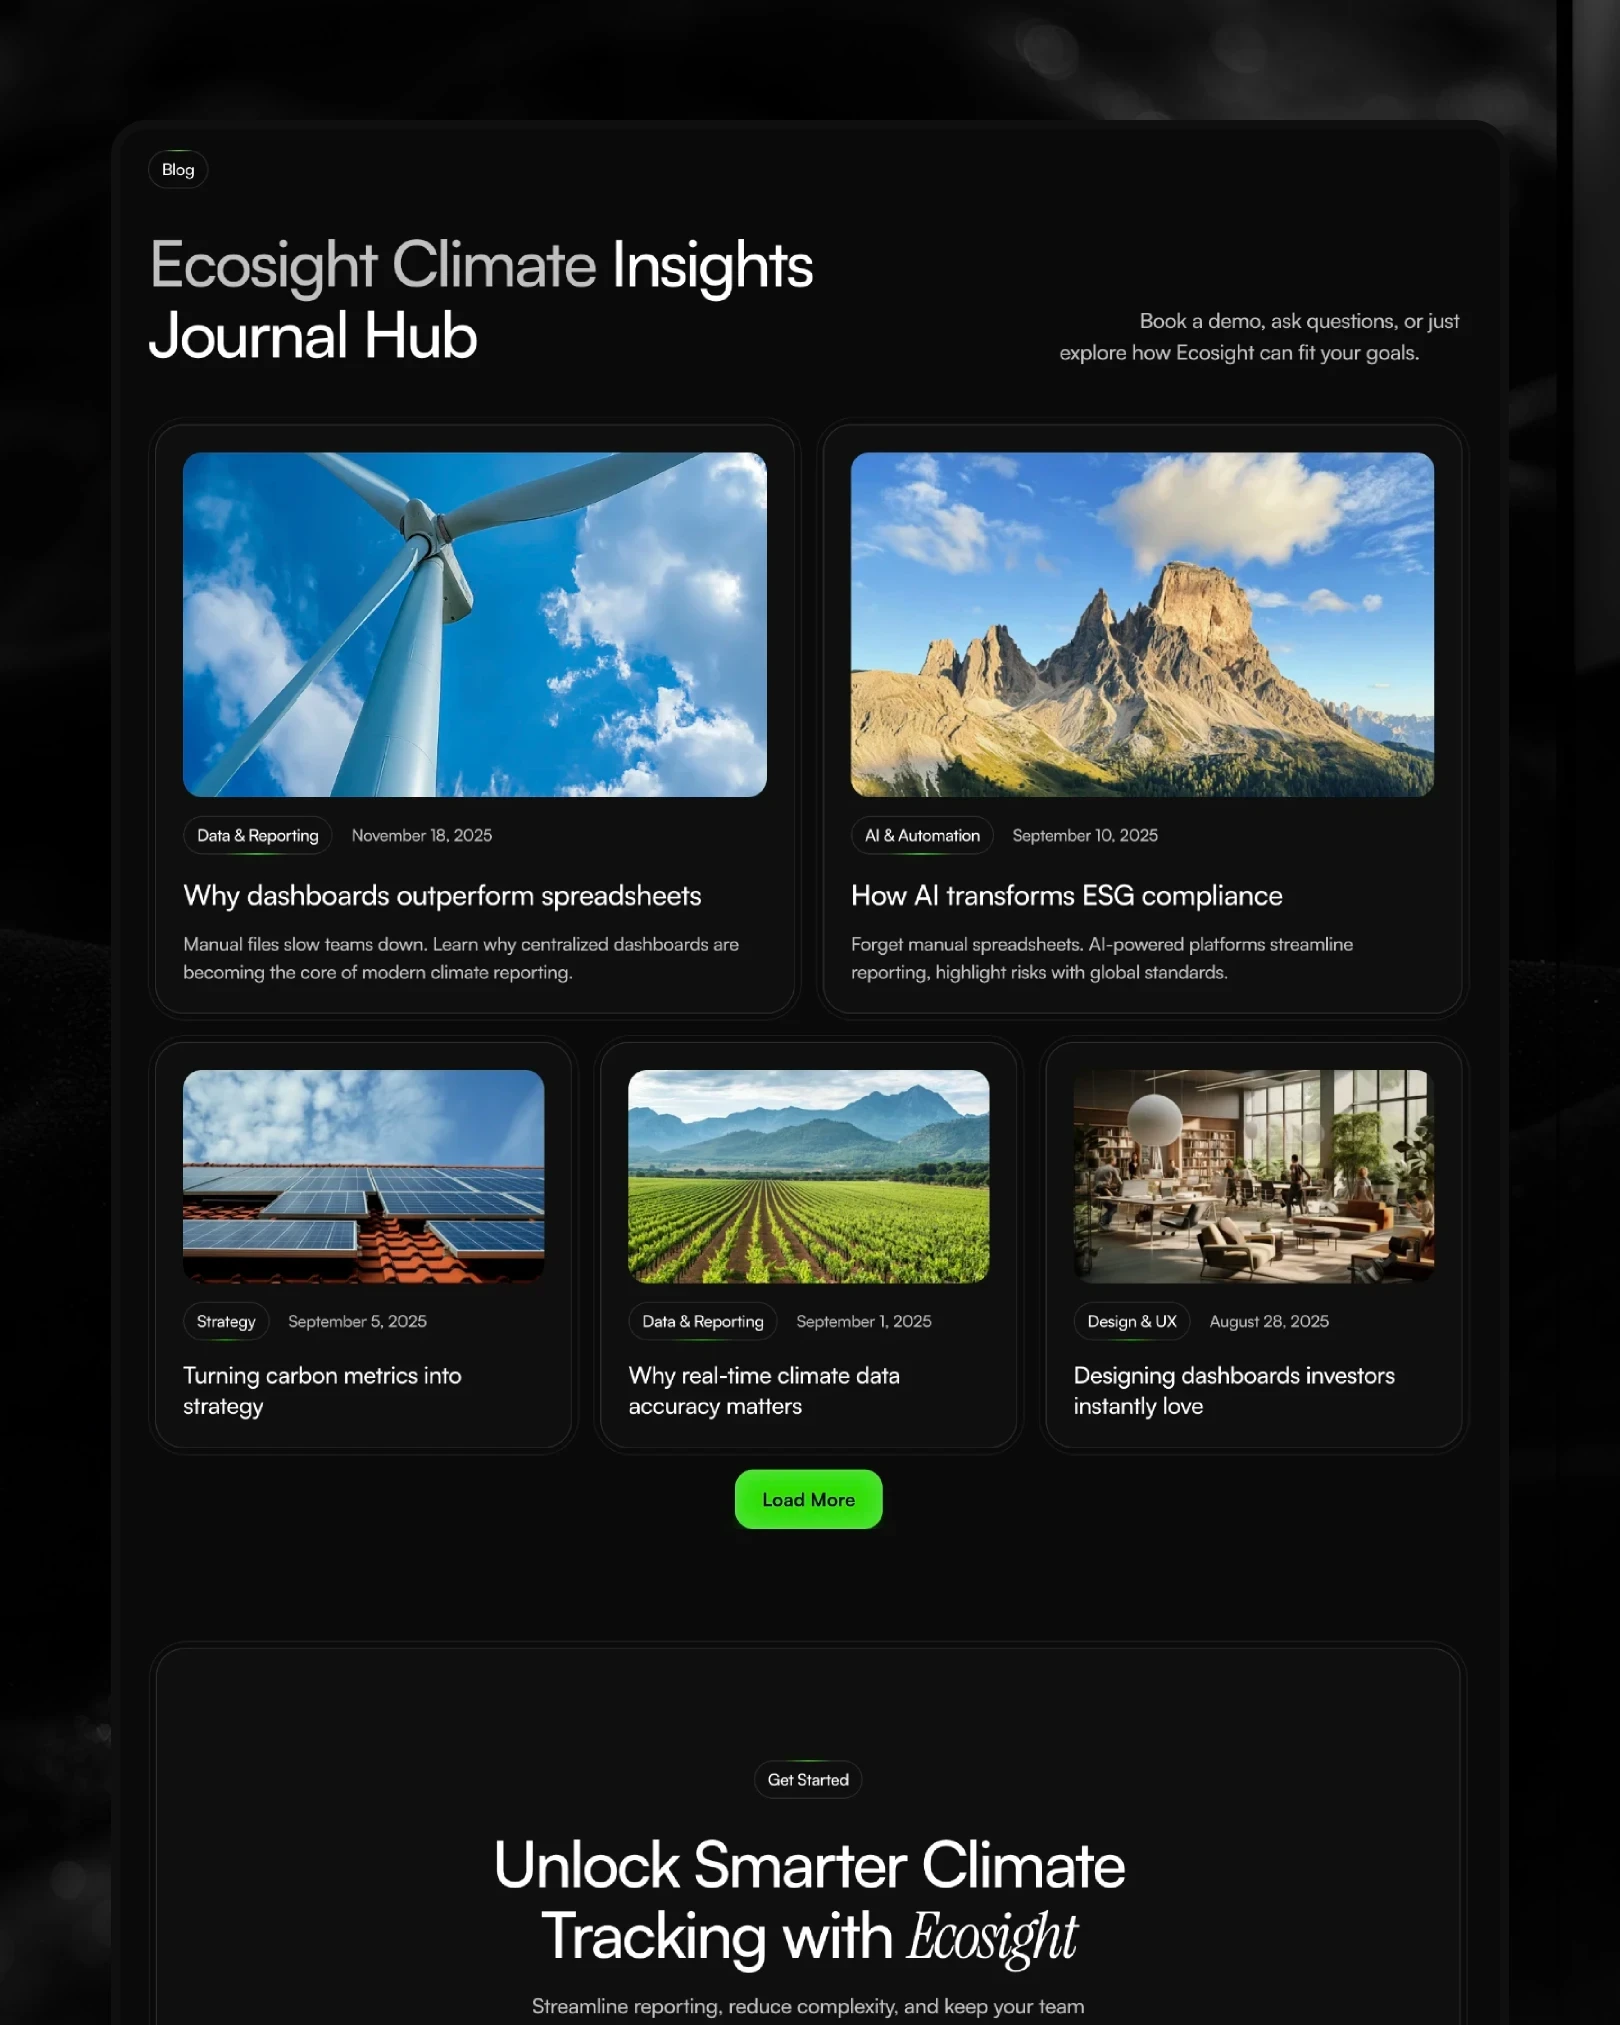
Black base, green signal. The dark foundation holds calm. Green appears only where data is alive — active metrics, growth, live insights. Color marks where to look.
01
Color
Black base, green signal. The dark foundation holds calm. Green appears only where data is alive — active metrics, growth, live insights. Color marks where to look.
01
Type
A grotesque for structure, a serif italic for emphasis. The hero breaks one word — Analytics — into italic, so the headline has a pause inside it. Confident, not loud.
02
Type
A grotesque for structure, a serif italic for emphasis. The hero breaks one word — Analytics — into italic, so the headline has a pause inside it. Confident, not loud.
02
Layers
The dashboard is a hierarchy, not a grid of equal cards. Impact first, metrics second, trends underneath. The layout tells you what matters before you read a number.
03
Layers
The dashboard is a hierarchy, not a grid of equal cards. Impact first, metrics second, trends underneath. The layout tells you what matters before you read a number.
03


RESULT
A product that reads itself
Ecosight launched as one connected surface — dense climate data made legible, a full visual language ready to scale across the product. Not screens that look good in a deck. A system built to grow.
Ecosight launched as one connected surface — dense climate data made legible, a full visual language ready to scale across the product. Not screens that look good in a deck. A system built to grow.
Project
Project
Project
Project
Project
Project